

Among 25 to 34-year-olds in the UK with any cash savings, the median balance in 2024 was between £3,000 and £3,999. That figure comes from the Financial Conduct Authority, which interviewed 17,950 adults for its Financial Lives 2024 survey. Finder’s savings statistics for 2026 put the average for the same age group at £11,023.
The distance between those two numbers comes down to what each one counts, and which kind of average sits behind it. Most pages quoting average savings by age in the UK don’t say.
How the FCA measures savings
The survey’s measure is “investible assets”: money in savings accounts and cash ISAs, anything in a current account the person thinks of as savings, and the market value of investments such as a stocks and shares ISA. Property and defined contribution pensions are excluded, as set out in the notes to the FCA’s cash savings slide pack. Anyone holding joint savings includes only the share they regard as theirs.
Fieldwork ran from 5 February to 16 June 2024. Around a quarter of respondents (24%) didn’t know their total or preferred not to say, and the FCA leaves them out of the figures below.
Savings by age: the FCA figures
| Age | Median investible assets | Nil or under £1,000 | £10,000 or more |
|---|---|---|---|
| 18 to 24 | £1,000 to £1,999 | 44% | 20% |
| 25 to 34 | £2,000 to £4,999 | 39% | 30% |
| 35 to 44 | £2,000 to £4,999 | 37% | 32% |
| 45 to 54 | £2,000 to £4,999 | 31% | 39% |
| 55 to 64 | £10,000 to £19,999 | 23% | 54% |
| 65 to 74 | £20,000 to £49,999 | 14% | 68% |
| 75 and over | £50,000 to £99,999 | 9% | 74% |
| All adults | £5,000 to £9,999 | 29% | 43% |
Source: FCA Financial Lives 2024, cash savings slide pack, slide 37. All UK adults, excluding “don’t know” and “prefer not to say” responses. The FCA publishes medians as bands rather than exact amounts.
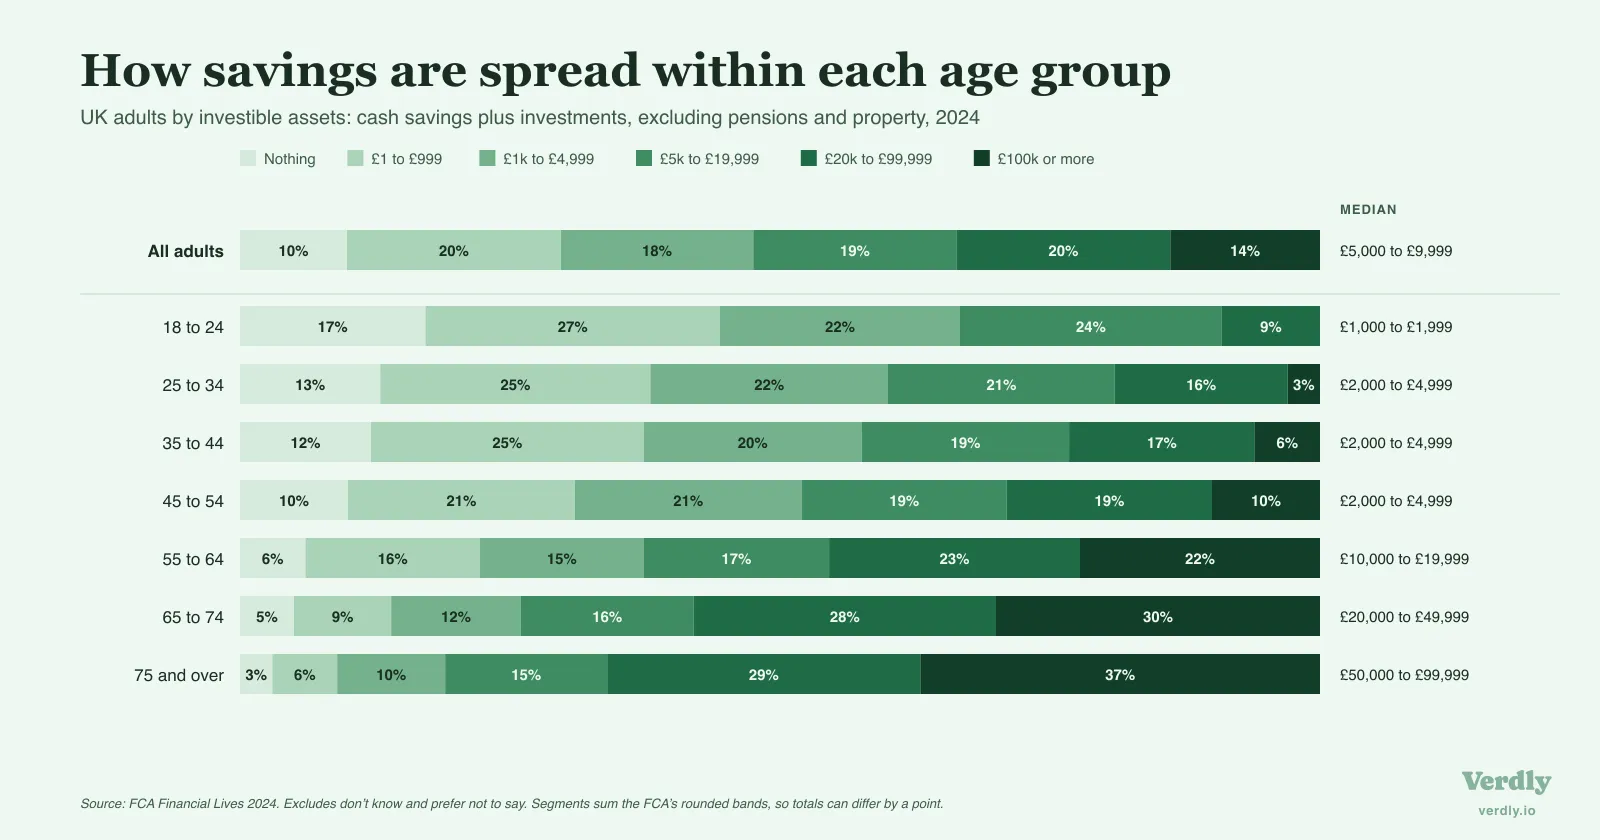
“Nothing” here means no savings or investments of any kind, including money set aside in a current account. The FCA gives it as a range, 7% to 10%, because of the 24% who didn’t give a figure.
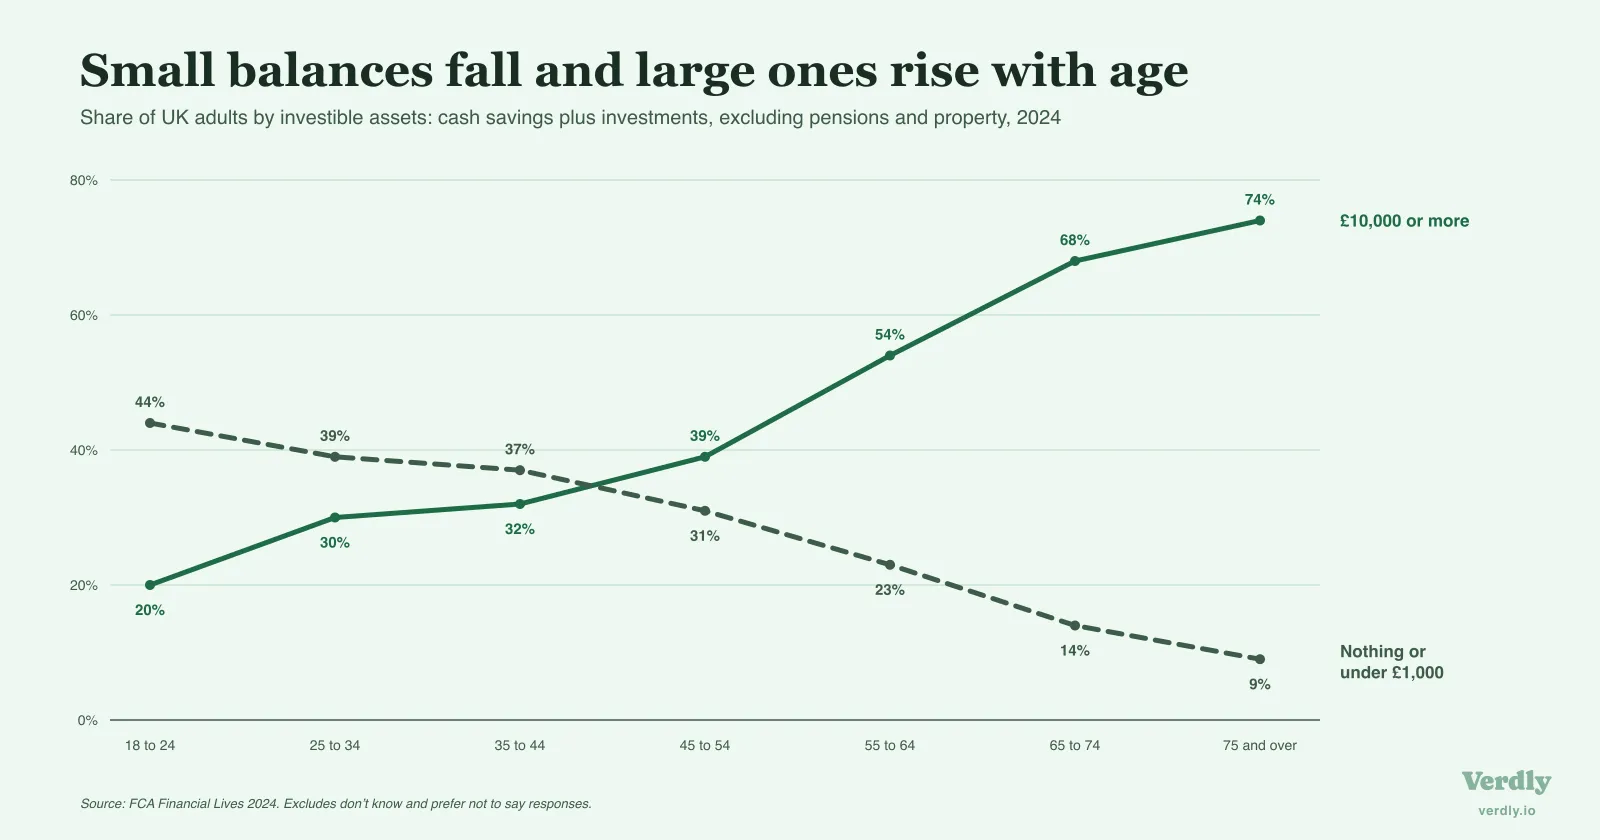
The median sits in the same band from 25 right through to 54. Three decades of working life share a £2,000 to £4,999 midpoint, and the climb starts in the 55 to 64 group. Nearly four in ten adults aged 25 to 44 hold under £1,000 in savings and investments combined, or nothing at all.
Cash savings, for people who have them
The FCA also reports cash on its own, counting only the people who hold some.
| Age | Have cash savings | Median cash savings, among savers |
|---|---|---|
| 18 to 24 | 82% | £2,000 to £2,999 |
| 25 to 34 | 86% | £3,000 to £3,999 |
| 35 to 44 | 87% | £3,000 to £3,999 |
| 45 to 54 | 89% | £4,000 to £4,999 |
| 55 to 64 | 93% | £10,000 to £14,999 |
| 65 to 74 | 95% | £20,000 to £29,999 |
| 75 and over | 97% | £30,000 to £49,999 |
Source: FCA Financial Lives 2024, cash savings slide pack, slide 41. Median bands are for adults with cash savings, excluding “don’t know” and “prefer not to say” responses.
Across all adults with cash savings, the median was £5,000 to £5,999.
Why other averages run higher
Savings are spread very unevenly. Across all UK adults in the FCA data, 10% hold nothing and 20% hold between £1 and £999, while 6% hold £250,000 or more. That top 6% pulls a mean far above what most people hold, the same skew covered in why net worth figures use the median.
Finder’s figures come from a Censuswide poll of 2,000 adults in Great Britain, carried out from 12 to 14 January 2026. Its savings statistics page doesn’t state whether its averages are means or medians, or what counts as savings. The same poll found 39% of adults with £1,000 or less. The FCA’s equivalent is 29% with nothing or under £1,000, on a slightly different cut-off and counting only people who answered.
What these figures leave out
Investible assets exclude the two largest parts of UK household wealth: property and pensions. A 40-year-old with £3,000 in an easy-access account might also have £60,000 in a workplace pension and equity in a flat, and this survey sees only the £3,000. Whether your pension counts towards your net worth is a separate argument, and for these figures the FCA has already settled it by leaving pensions out.
The Office for National Statistics measures something different again. Its Wealth and Assets Survey for April 2020 to March 2022, no longer an accredited official statistic, puts median financial wealth at £1,300 for households headed by someone aged 25 to 34. That figure covers a whole household, subtracts financial liabilities from savings and investments, and predates the FCA’s fieldwork by two years or more. The ONS household totals, with property and pensions back in, are in how net worth looks by age, and the average pension pot by age covers pensions on their own.
Verdly publishes for education, not financial advice. Your circumstances will differ, so speak to a regulated adviser for decisions specific to you.
A savings balance is one line on a balance sheet, and it moves with every bill and every payday. Recorded at the same point each month next to the pension, the mortgage and any debts, it builds into a record of direction over years, which is what a simple net worth tracker is for.
For the middle saver aged 25 to 34, the FCA’s answer is £3,000 to £3,999 in cash, alongside nearly four in ten people that age with under £1,000 in total. Read together, those two figures say more about what’s normal than any single average.
Last reviewed 26 October 2026.