


Prices in the UK were 3.1% higher in August 2026 than in August 2025, according to the ONS consumer price inflation bulletin for August 2026. A net worth that grew by less than 3.1% over those twelve months buys less now than it did a year ago, whatever the total says.
Trackers, spreadsheets and apps report that total in nominal pounds by default, and almost none of them say so. Turning it into an inflation-adjusted net worth takes one published number and one line of arithmetic.
Verdly publishes for education, not financial advice. Your circumstances will differ, so speak to a regulated adviser for decisions specific to you.
A unit that changes size
A net worth record is a column of pounds, each written down on a different date. That makes the pound an awkward unit for a long record, because what one pound buys is remeasured by the ONS every month.
Subtracting last August’s figure from this August’s mixes two movements: what happened to your assets and debts, and what happened to the pound. To isolate the first, the older figure has to be restated in the newer month’s prices.
The deflator is already published
Alongside the headline percentage, the ONS publishes CPI as an index with 2015 set to 100, and that index is the deflator. In the August 2026 bulletin it stood at 139.3 for August 2025 and 143.6 for August 2026.
Restating an older figure in current prices is:
older figure × (current index ÷ older index)
Callum’s net worth was £180,000 in August 2025 and £186,000 in August 2026. Nominally, that is a gain of £6,000, or 3.33%.
Restated in August 2026 prices, his August 2025 figure becomes:
£180,000 × (143.6 ÷ 139.3) = £185,556
Measured against that, his real gain over the year is £444, or 0.24%. The £444 is what the year added in purchasing power, which is usually what someone looking back over a year wants to know.
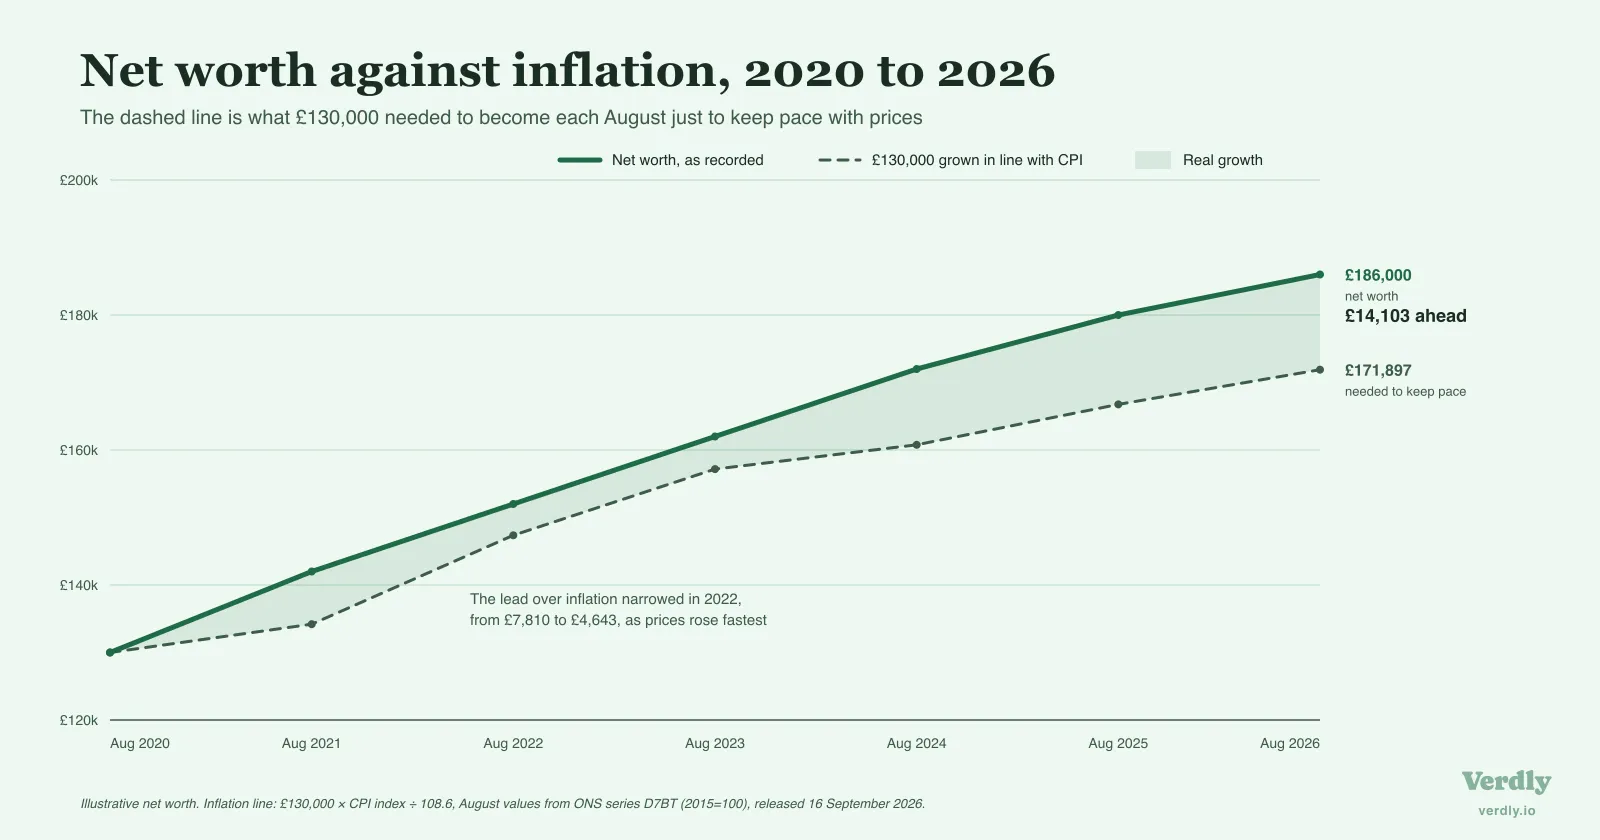
The method works across any span. A figure from five years ago uses that month’s index in place of 139.3, and every point in a series can be restated into a single month’s prices, so the whole history is drawn in one unit.
Picking an index
The same ONS release puts CPI at 3.1% and CPIH at 3.3% for the year to August 2026. CPIH adds owner occupiers’ housing costs, about 18% of its basket, and that component accounts for most of the gap. RPI still appears in some contracts and index-linked products, but it is no longer a National Statistic and the ONS does not treat it as a measure of household inflation.
On Callum’s £180,000, the 0.2 percentage point difference between CPI and CPIH is worth about £360 over the year. That is most of his real gain.
No index fits every household. CPIH folds in the cost of owning a home; CPI is the measure the Bank of England targets and the one most often quoted. Whichever is used, it has to be applied to every point in the series and the result labelled, as in “August 2026 prices, CPI”. A real-terms figure without its index and base month can’t be checked later, even by the person who worked it out.
How far the national figure fits
CPI measures price change across a national basket weighted by average household spending. In the year to August 2026, motor fuels rose 23.0% while food and non-alcoholic beverages rose 1.3%, the lowest annual rate for that group since September 2021. Transport made the largest upward contribution to the rise in the annual rate that month.
A household that drives long distances for work faced steeper price rises than the headline 3.1%. A CPI-deflated figure is an approximation of what your own pounds lost, though a far closer one than treating the pound as fixed.
Why the gap is widening
At its meeting ending 16 September 2026, the Bank of England’s Monetary Policy Committee held Bank Rate at 3.75% by six votes to three, with the three minority members voting for 4%. The Committee expected CPI inflation to rise to around 3¾% in the final quarter of 2026, up from 3.2% at the time of its July projections.
CPI and CPIH have both risen for two consecutive months to August 2026. If the Bank’s expectation holds, the nominal growth a net worth needs just to stand still in real terms keeps rising through the rest of the year.
Fixed targets drift
The Adam Smith Institute’s Millionaire Tracker estimates 442,000 sterling millionaires in Britain, measured in constant prices, down 7% since 2024 and the lowest count since 2008. It is a modelled estimate rather than a count: a single Pareto parameter fitted across all nine waves of the ONS Wealth and Assets Survey, applied to National Accounts household net worth of about £10.75 trillion in 2024. The ASI states that the method tracks year-to-year change more reliably than the absolute level, and its page describes the price base as constant 2025 prices in one place and constant 2015 prices in another, so the direction of change is the safer thing to take from it.
Because the threshold is held at £1 million in constant prices, it rises in nominal pounds every year, so the number of people clearing it can fall while nominal wealth grows.
A personal milestone set in pounds drifts the same way. A target of £250,000 chosen in 2020 describes less purchasing power in 2026, and a nominal record gives no sign of it until the target is restated with the index for the month it was set.
What the record has to hold
Deflating a figure needs the month it describes as well as the value, so the method depends on a record that appends rather than overwrites, with a date on every entry.
It also needs entries far enough apart for the deflator to matter. From one month to the next the CPI index moves by a few tenths of a per cent, less than ordinary movement in most portfolios and less than the uncertainty in valuing a house or a pension. Real-terms comparison earns its keep over a year or more, which is a separate decision from how often the underlying numbers genuinely change and so how often to record them.
A net worth tracker built on dated snapshots keeps the month beside every figure, which is what lets a series be restated. In Verdly, each snapshot in your history carries the date it describes as well as the total.
A nominal record tells you how many pounds you hold. Restated with the index, it shows whether a year of saving and investing left you able to buy more than when the year began, and for anyone who kept the dates, finding out takes one division.